Web3CDN Network · Indexer.tools

The Graph designer, GraphQL visualizer & subgraph debugger

Indexer.tools is our production toolkit for subgraph developers: a GraphQL designer for The Graph and SubQuery schemas, a The Graph visualizer for live deployments, and a Subgraph Inspector that works as a The Graph debugger for mapping handlers — built and supported by Web3CDN Network.

thegraph designergraphql designerthegraph visualizerThe Graph debuggersubgraph inspector

Why teams use Indexer.tools

Shipping a subgraph is rarely just “write a schema and hope.” Teams need a GraphQL designer to see entities and relations, a GraphQL visualizer tied to real CIDs, and a subgraph debugger that shows which events and contract methods feed each handler.

Indexer.tools gives that visual path for The Graph and SubQuery: map the architecture first, then validate mapping behavior with block-aware context — before production surprises.
Indexer.tools — subgraph development and debugging by Web3CDN Network

Toolkit

Services inside Indexer.tools

One suite covering GraphQL design, The Graph visualizer workflows, and mapping-level debugging.

GraphQL & schema

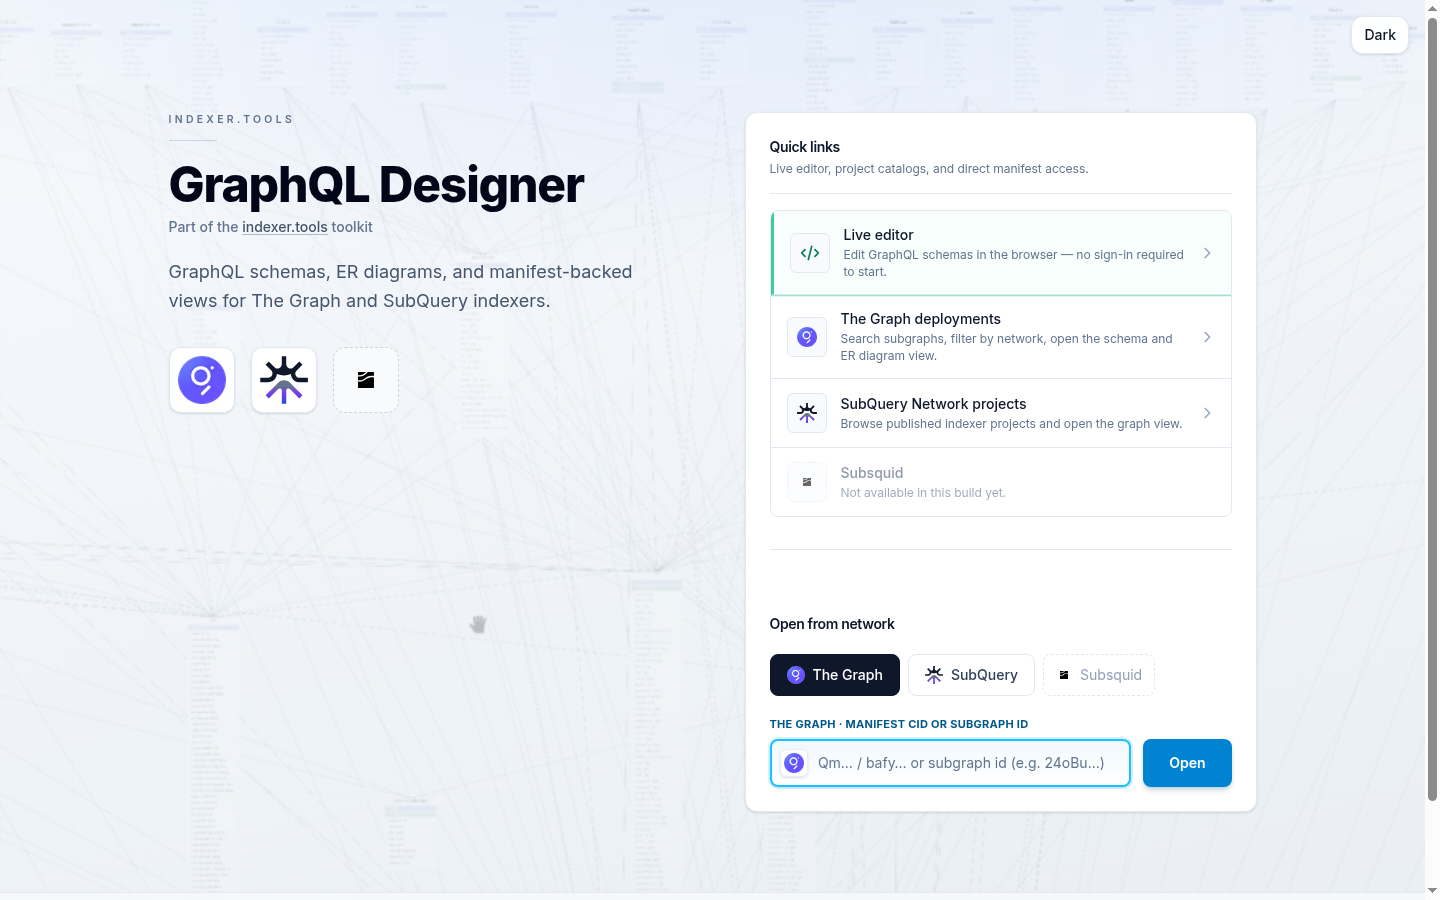
GraphQL Designer

The Graph designer and GraphQL schema visualizer: edit indexer schemas on an ER-style canvas, open deployments by CID, and manage projects for The Graph and SubQuery.

  • Interactive ER diagram with on-canvas GraphQL edits (D3 / dagre)
  • Open live deployments via IPFS manifest CIDs and subgraph IDs
  • Projects, galleries, live editor, and account workflows
Open GraphQL Designer
GraphQL Designer

Mapping & execution

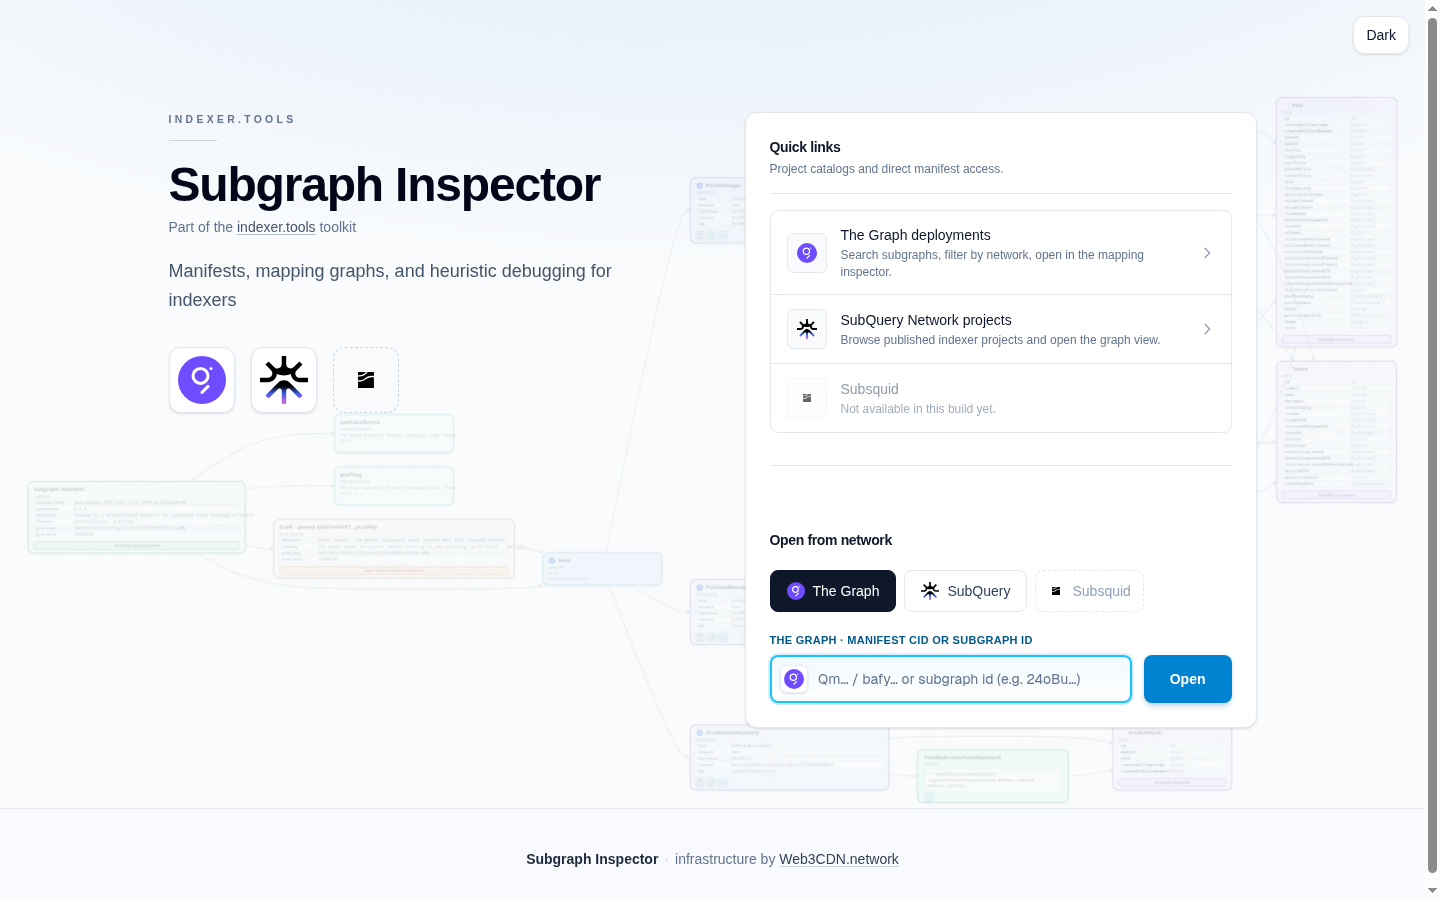
Subgraph Inspector

The Graph debugger and mapping inspector: load a resolved manifest, navigate the code relationship graph, and step through handler traces with optional on-chain context.

  • Data sources, handlers, and entities in one navigable graph
  • Handler trace with mock store writes and block/log tie-in
  • WASM / mapping source visibility and diagram export for reviews
Open Subgraph Inspector
Subgraph Inspector

Monitoring & alerts

EagleEye

Production monitoring for indexers: health checks, desync signals, and alerts over Telegram and email when mappings or sync posture drift.

  • Continuous indexer health and sync posture checks
  • Failure and anomaly alerts to Telegram and email
  • Signals for desync and inconsistent indexed data

Public link — coming soon

EagleEye

Capabilities

From GraphQL designer to The Graph debugger

Concrete jobs Indexer.tools covers for indexer engineers and protocol teams.

Visual The Graph designer

Model subgraph GraphQL the way you reason about it — as an entity graph — then sync changes back into schema text without losing structure.

GraphQL visualizer for real deployments

Open The Graph or SubQuery deployments by CID or project id and inspect the live schema instead of guessing from stale docs.

Subgraph debugger for mappings

Trace handlers, inspect store writes, and relate execution paths to block or log context before a bad mapping ships to production.

Built for indexer workflows

Manifest-first tooling for teams that ship subgraphs and SubQuery projects — not a generic block explorer with GraphQL bolted on.

Product gallery

Screenshots

GraphQL designer canvas, project workspace, and Subgraph Inspector entry points.

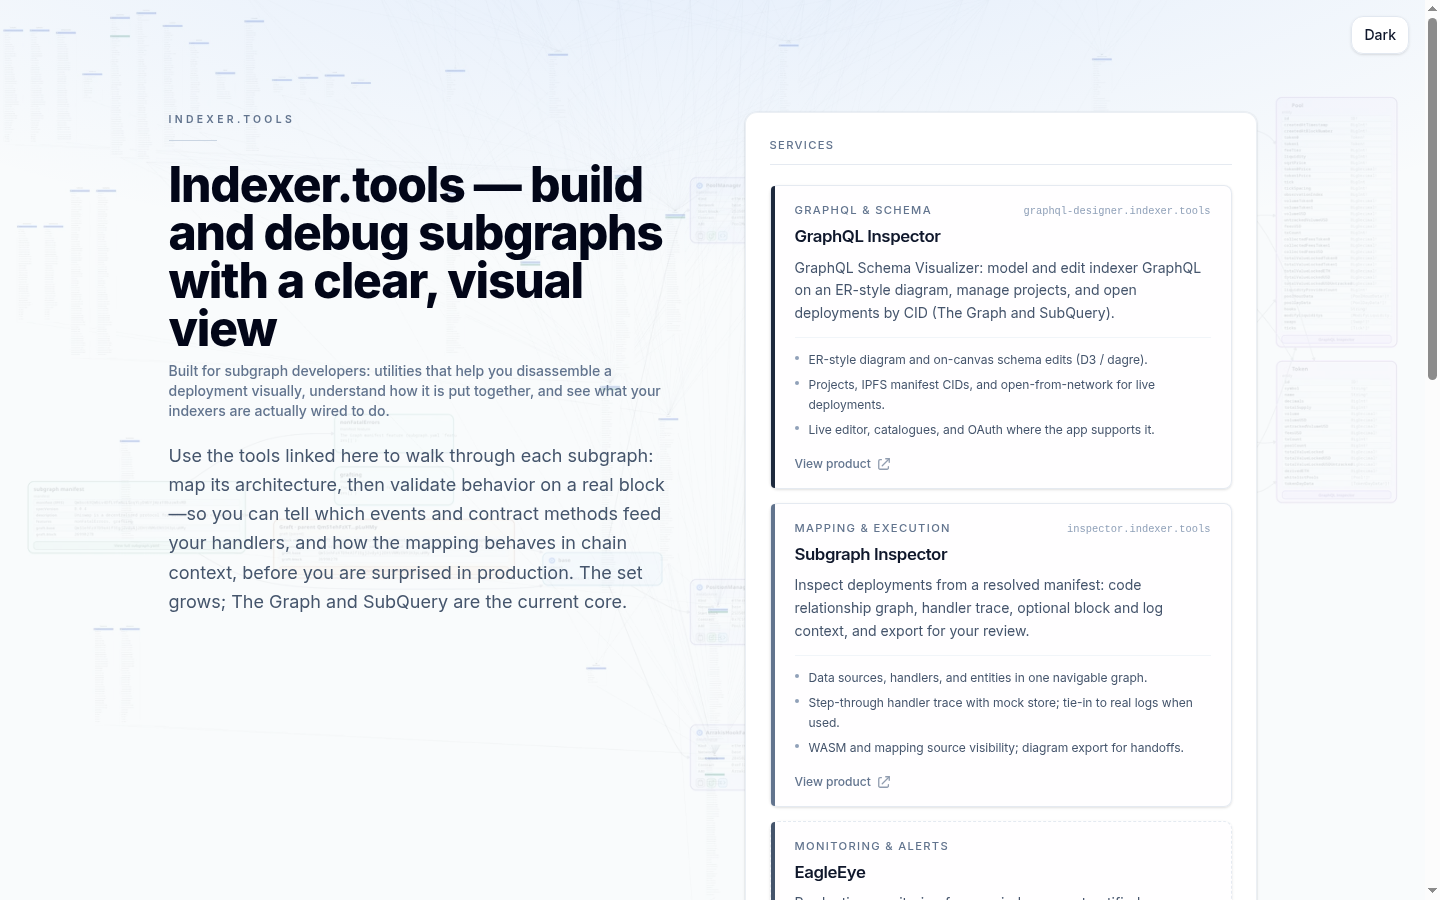
Indexer.tools hub

Product hub for The Graph designer, GraphQL visualizer, and subgraph debugger tools.

GraphQL Designer

Open The Graph or SubQuery deployments and explore schemas as ER diagrams.

Schema visualizer

The Graph visualizer canvas for entities, relations, and on-diagram edits.

Project workspace

Manage designer projects, forks, and manifest-backed imports.

Live editor

Browser-based GraphQL designer with validation — no install required.

Subgraph Inspector

Manifest-first The Graph debugger for mappings, handlers, and traces.

SEO-friendly answers for common searches

Looking for a thegraph designer, graphql designer, thegraph visualizer, or The Graph debugger? Indexer.tools is the Web3CDN Network suite that combines those jobs: design GraphQL schemas visually, visualize live subgraph deployments, and debug mapping execution paths.

Start with GraphQL Designer for schema work, then move to Subgraph Inspector when you need handler-level debugging.

FAQ

Frequently asked questions

Short answers for The Graph designer, GraphQL visualizer, and debugger searches.

What is Indexer.tools?

Indexer.tools is a Web3CDN Network toolkit for subgraph development and debugging. It includes a GraphQL designer / The Graph visualizer, a Subgraph Inspector (The Graph debugger for mappings), and EagleEye monitoring.

Is Indexer.tools a The Graph designer and GraphQL designer?

Yes. GraphQL Designer on indexer.tools is a The Graph designer and GraphQL schema visualizer: ER-style diagrams, live schema editing, and open-from-network for The Graph and SubQuery deployments.

Can I use Indexer.tools as a The Graph debugger or subgraph debugger?

Subgraph Inspector acts as a The Graph debugger / subgraph debugger for mapping logic. Load a manifest, explore the code relationship graph, step through handler traces, and optionally attach block or log context.

Does the GraphQL visualizer support SubQuery as well as The Graph?

Yes. The GraphQL visualizer and Subgraph Inspector currently target The Graph and SubQuery as the core platforms, with more indexer ecosystems planned as the suite grows.

Who builds and supports Indexer.tools?

Indexer.tools is developed and supported by the Web3CDN Network team — the same operators who run production indexing and infrastructure tooling.

Ready to design and debug subgraphs visually?

Open the live toolkit or talk to Web3CDN Network about indexer tooling, monitoring, and custom integrations for your network.